
 (Amounts in thousand pesos, except earnings per share, (Amounts in thousand pesos, except earnings per share,which is shown in pesos, and outstanding shares) |
2018 | 2019 | 2020 | Var% 2020-2019 |
|---|---|---|---|---|
| Sales | 96,639,833 | 102,477,596 | 94,684,370 | -7.6% |
| Gross Profit | 28,659,561 | 29,139,883 | 23,728,955 | -18.6% |
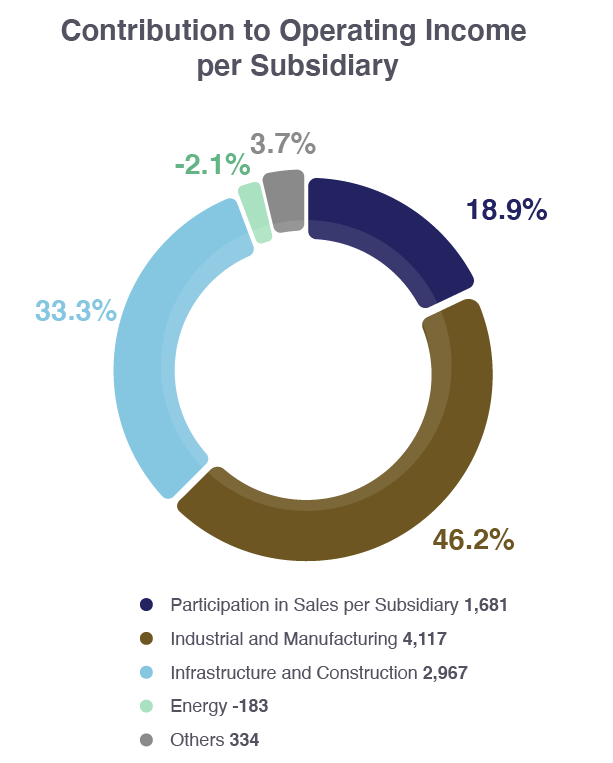
| Operating Income | 11,032,226 | 11,453,226 | 8,916,259 | -22.2% |
| EBITDA | 14,433,693 | 14,481,063 | 11,206,330 | -22.6% |
| Controlling Participation in Net Income | 9,170,294 | 7,547,361 | 5,706,408 | -24.4% |
| Utilidad por acción (UPA)* | 4.02 | 3.31 | 2.51 | -24.2% |
 Margins Margins |
||||
| Gross | 29.7% | 28.4% | 25.1% | -3.4 pp |
| Operating | 11.4% | 11.2% | 9.4% | -1.8 pp |
| EBITDA | 14.9% | 14.1% | 11.8% | -2.3 pp |
| Net | 9.5% | 7.4% | 6.0% | -1.3 pp |
 Revenues Revenues |
||||
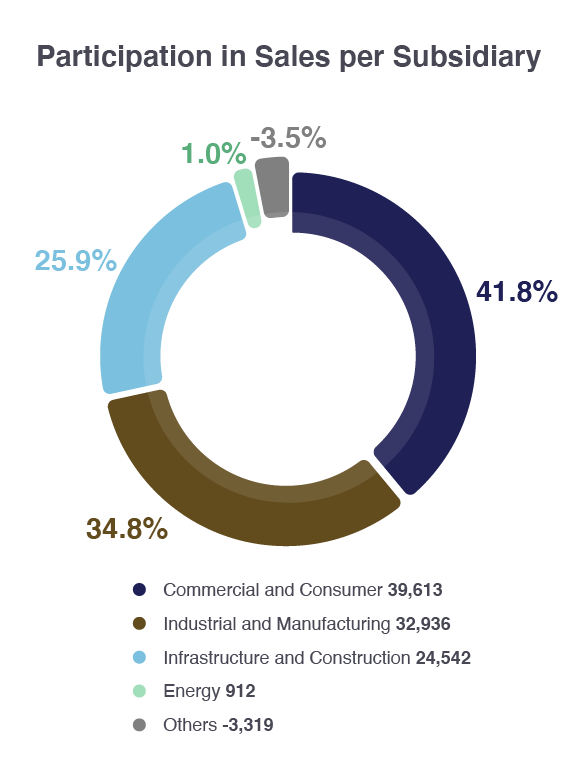
| Retail | 51,755,422 | 53,288,479 | 39,612,874 | -25.7% |
| Industrial | 30,929,859 | 31,746,579 | 32,936,523 | 3.7% |
| Infrastructure and Construction | 15,504,207 | 19,537,994 | 24,541,851 | 25.6% |
| Energy | 72,354 | 51,570 | 911,757 | 1668.0% |
 EBITDA** EBITDA** |
||||
| Retail | 7,200,612 | 6,789,470 | 2,040,573 | -69.9% |
| Industrial | 4,404,034 | 4,240,699 | 4,653,908 | 9.7% |
| Infrastructure and Construction | 2,235,328 | 2,706,603 | 3,644,920 | 34.7% |
| Energy | -37,396 | -9,324 | 560,633 | NA |
 EBITDA Margins EBITDA Margins |
||||
| Retail | 13.9% | 12.7% | 5.2% | -7.6 pp |
| Industrial | 14.2% | 13.4% | 14.1% | 0.8 pp |
| Infrastructure and Construction | 14.4% | 13.9% | 14.9% | 1.0 pp |
| Energy | -51.7% | -18.1% | 61.5% | 79.1 pp |
| Total Assets | 144,222,024 | 150,453,925 | 169,826,599 | 12.9% |
| Total Liabilities | 51,835,944 | 55,809,365 | 69,111,756 | 23.8% |
| Stockholders' Equity | 92,386,080 | 94,644,560 | 100,714,843 | 6.4% |
| Compounded Average Outstanding Shares ('000) | 2,281,595 | 2,280,862 | 2,276,143 | -0.2% |
*EPS: Calculated as Controlling Participation in Net Income divided by the compounded
average shares outstanding.
**EBITDA: income before income taxes plus depreciation and amortization, interest expense,
impairment of machinery and
equipment and exploration expenses, and effect on valuation of derivative financials
instruments, less interest income, net
foreign exchange gain, surplus from appraisals of shopping centers and equity in earnings of
associated companies and joint
ventures. Conciliation in Note 30 of the Financial Statements.
.
pp: Variation in percentage points.
*Note: For the calculation of 2018 EBITDA, the net effect of the depreciation of fixed assets, exploration and mercantile credit expenses and the reappraisal of investment properties were included. For the calculation of 2019 EBITDA the net effect of the reappraisal of investment properties, the reversion of the depreciation of fixed assets and repair of the environment were not included. For the calculation of 2020 EBITDA, the net effect of the reappraisal of investment properties, the valuation of labor obligations, deterioration of exploration expenses, depreciation of fixed assets and repair of the environment were not included..
